.svg)
We're Transforming Reports

We're Transforming Reports
At Shortcut we care a lot about the health of our teams. And recently, we've been prioritizing a more metrics-driven understanding of our team health and performance. Understanding these metrics has been critical to promoting healthy team workflows and meeting our commitments -- and this currently requires a lot of manual effort and overhead.
Answering recurring questions about delivery timelines or team performance requires us to compare data across multiple historic Iterations to find our average Iteration capacity and throughput (read: copy/paste # of stories/points, and manually count the carryover 🥵).
So we started exploring how we can improve our reports to generate insights and answer the questions we ask ourselves each Iteration. We also reached out to you all to understand what would help you best plan and manage your Iterations with team delivery metrics.
📈 The resounding sentiment is that we all want better data on how we work together to deliver work, and better tools for planning and managing Iterations.
Our First Steps to Better Reporting
The first changes we've made are meant to make reports easier to use, especially in the case of viewing delivery trends over previous Iterations.
- "Group by Iteration" on the Reports page to review historic data for team's regular working intervals – now supported in Velocity, Burndown, Cycle Time and Cumulative Flow charts
- Cumulative Flow Diagram is a stacked area chart for easier visualization of workflow states over time (arrival/departure rate and throughput)
- Cycle Time supports custom start and end states for fine-tuned tracking
- Filters are sticky on the Reports page so you always know what's applied
- Chart preferences are saved when you leave and return to the page

Up Next: Iteration Reports and Insights
In the coming months, we'll be transforming Reports to better serve user needs. Our next releases will focus on improvements to Iteration reporting to better understand Iteration progress, and plan for upcoming Iterations based on historic data.
❓Quickly answer questions like:
- Who is working on what?
- Will we meet our Iteration commitments?
- How is our delivery cadence/speed trending?
➡️ Here's a peek at what we're we're cookin' up:
- Insights surfaced on each chart to quickly outline key takeaways and give your team the opportunity to make changes before you miss your commitments
- At-a-glance Iteration progress with spark-line versions of our charts, summarized at the top of the Iteration view to quickly understand the Iteration health and progress

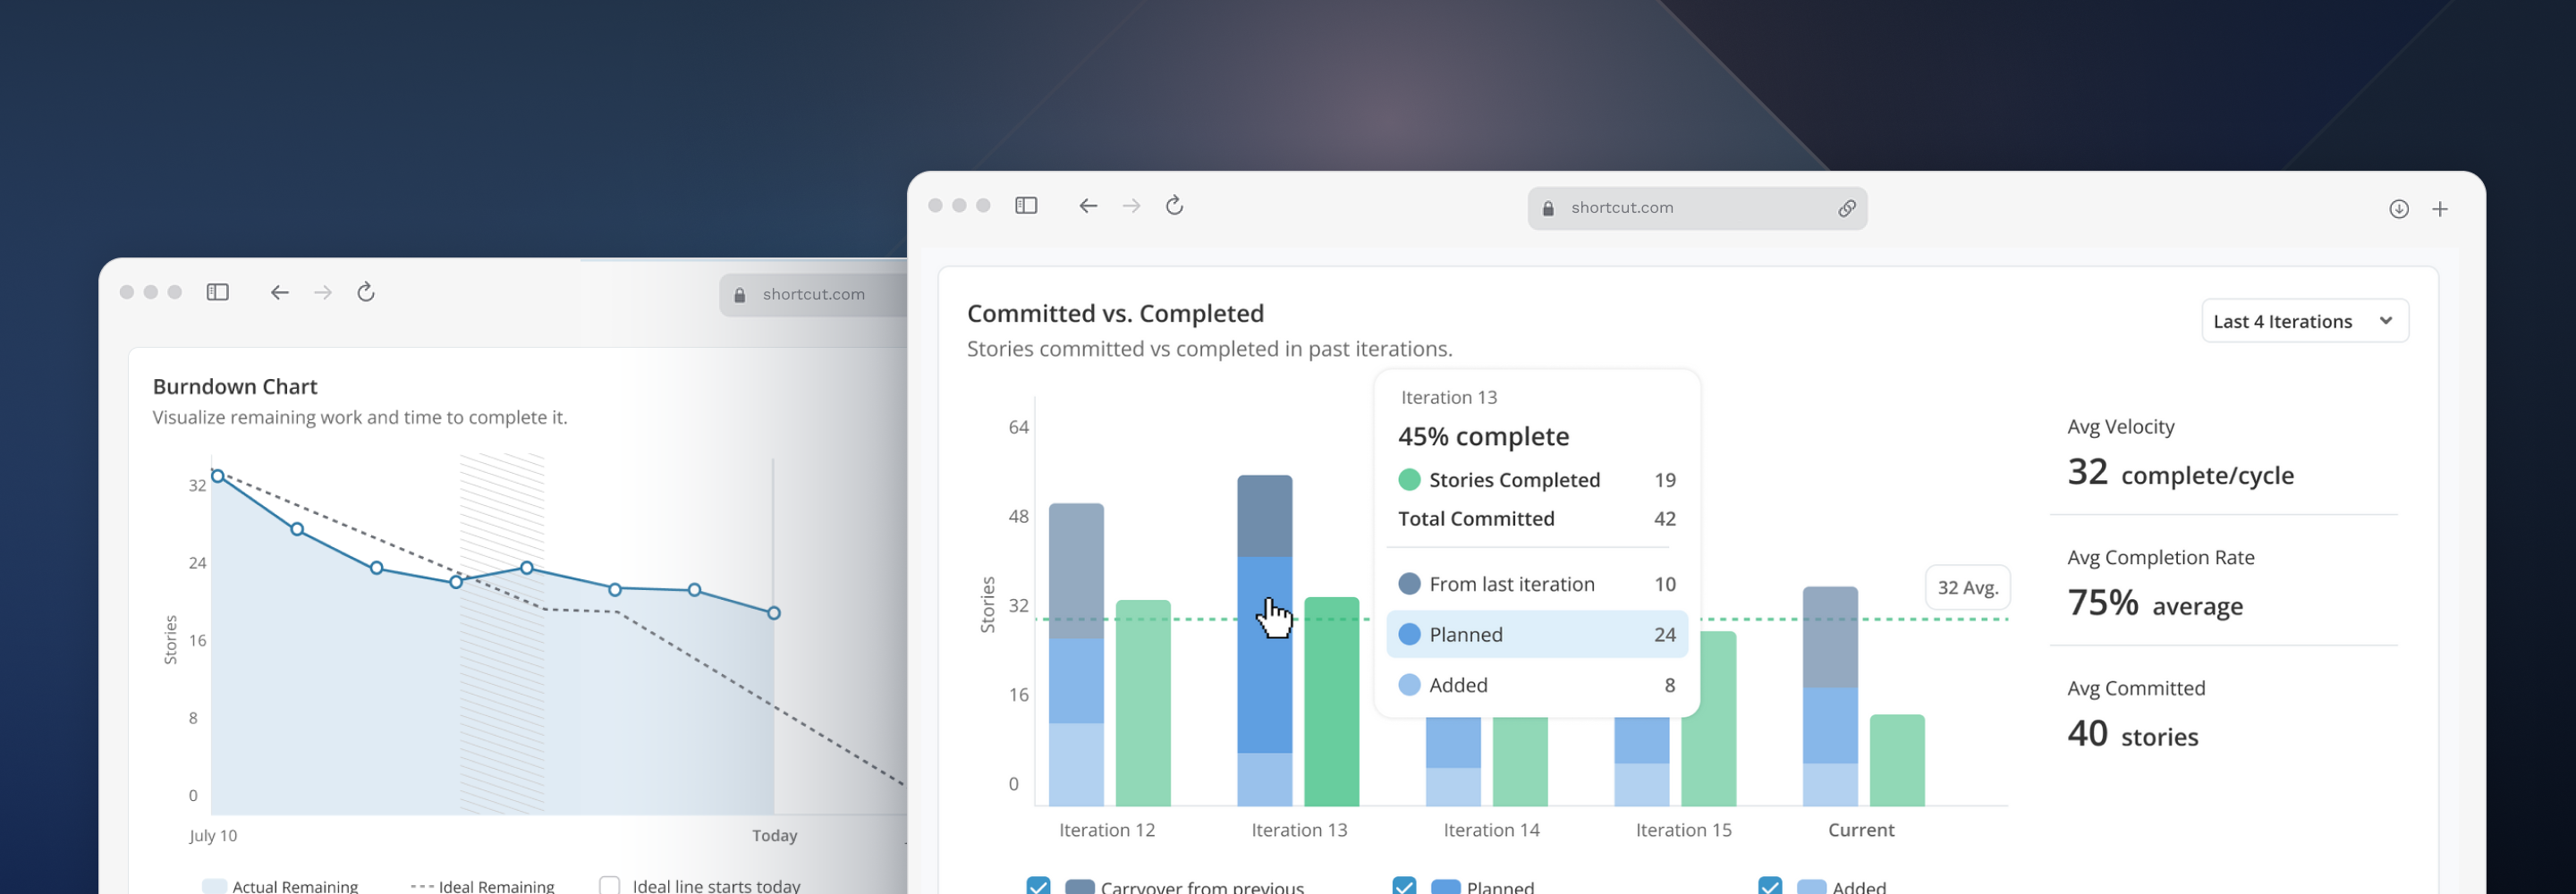
We'll also be introducing two new tools for planning and managing your Iterations: a Committed vs. Completed report and a Capacity Planner. These tools will help make decisions based on historic Iteration data and track how effective your team is at planning and delivering on commitments, over time.

📦 This will be all out-of-the-box — no configuration required. Your team will start benefiting from actionable insights during their very first Iteration with no additional effort or specialized knowledge to setup dashboards to track team performance metrics. We're lowering the barrier to entry, so your team can be data-informed.
Want more? Sign-up for Early Access!
We have a lot more coming to better understand your team's performance, and support planning and management of team Iterations. Thank you to everyone who participated in research to help us learn what you are looking for!
Sign-up for Early Access to new reports and insights to better plan and manage your Iterations.