What’s new?
Stay up-to-date with our weekly release notes.

"View on Stories Page" from any Epic detail page by clicking the button at the top of the Stories table, or the magnifying glass icon in the left panel.
The New Stories Page is here for everyone
Everyone’s now on the new Stories page: enjoy faster load times, improved filters, and WIP limits. The legacy Stories page has been retired.
Shortcut.com has a new look

Shortcut has a new website! We updated our brand to reflect what makes Shortcut great: fast, intuitive, and enjoyable to use.
Improvements and Fixes
- We've added 10 new integrations to our integration modal for easier discoverability, including: Plain, Guru, Aikido Security, Feedbucket, Make, Pipedream, Savio, Spike.sh, SureTriggers, Vanta and Zoho Cliq
- Clicking the Profile icon on the Email Settings page now works as expected
- Fixed a ghost toast! Editing then deleting a comment no longer haunts you with a “Your edits have not been lost” message
- Updating a Space name no longer triggers a warning when there’s nothing unsaved
- Pasting bullet points with asterisks now automatically removes duplicates asterisks to prevent formatting issues
- Images are now correctly inserted into the description content area rather than being added as attachments
We've released the first version of the open source Shortcut MCP server. Connect Shortcut to Cursor, Windsurf, Claude Code, and more. You can access and edit Stories and Epics in the apps to get your agents started coding and to connect the output directly to Github.
This is an early release that we plan to continue expanding. Bug reports and pull requests are welcome.
Faster List Editing in Markdown

We’ve improved the Markdown editor to help you move faster when creating and rearranging lists.
Here’s what’s new:
- Use
alt/option + ↑↓to move list items around - When copying a list item and pasting it into another list, we remove the automatically inserted bullet if the pasted content already contains a bullet
Improvements and Fixes
- Corrected a UI bug on the drop-down component of the Stories Page
- You’ll now see the provider and username when someone’s identity isn’t linked to Shortcut. No more mystery “somebody” making changes!
- Improved consistency when opening a new internal vs. external link
- Corrected a filter pill de-selection UI bug

See which Spaces are already in your Tab list when you open the "+Spaces" menu
Improvements and Fixes
- Improved filter logic for filtering workflow states on Spaces
- Only Save & Share changes to your Space when you need to. If you manually remove changes to your Space, the Space will revert to a "Saved" state 🙌
- Corrected a page load UI bug fix on table view when a story card is opened
- Updated the text on the Stories Page CSV export to include information related to Objectives
- Fixed a UI bug on the Cumulative Flow Diagram
You can now quickly copy Epic titles by right-clicking in our updated tables, including the Stories Page, making it easier to grab what you need and keep moving.
Improvements and Fixes
- Stories under "All Work" now load faster.
- No more missing details! Story descriptions now copy over when duplicating a Story within an iteration just like they should.
- When you create a new Space, it now defaults to the last workflow you visited, so you’re always starting where it makes sense.
- You can now shift-click to select multiple Stories in Table View, because who has time for one-by-one?
- Fixed a bug where duplicating a Story didn’t copy over the description, now it works like a charm.
- Story dialogs just got a speed boost. Now when you open a Story, background loading pauses to keep things smooth and snappy.
Managing complex projects means keeping track of how work connects and sometimes, that’s easier said than done. That's why we added better dependency visualization in Shortcut. Our new Mermaid chart maps dependencies in your Epic or Iteration, making it easy to spot Stories that are blocking or blocked instantly so your team can keep work moving smoothly.
Improvements and Fixes
- Corrected an issue that caused Team (not any of) filter on Stories page to show unexpected results

When you create a Story via the Slack action and select a Workflow, you'll see its available Workflow States to choose from. The default selection is the Workflow’s default state, making it faster and easier to create stories in the right place.
Improvements and Bug Fixes
- WIP limits now stay hidden when using the "Team is not any of" filter to keep your board neat and tidy.
- Importing from CSV now correctly auto-populates with the tool you’re coming from in the Talk to Us modal for a smoother process.

We added Objectives as a grouping option in table view on the Stories page - goals deserve the spotlight too.
Improvements and Fixes
- QuickSearch now keeps your query after closing a search session, because sometimes you just need to pick up where you left off.
- Adjusted the default team icon in the WIP Limits dropdown for proper fit.

You can now resize the main navigation bar to view full titles, making it easier to stay on top of the work you're checking out.

Get instant clarity on your workload with Story counts and Points now visible in the Kanban view.
Improvements and Fixes
- Our tables just got a refresh! You’ll notice a more compact style for easier scanning, updated header groupings and adjusted column widths for improved readability, consistent button sizing within table cells, and polished empty states across the board.
- Emoji shortcodes in URLs are now properly ignored.
- Corrected an issue on the invite new users screen that caused radio button content to not display.
- Fixed a bug in the Story dialogue drop-down UI that prevented the top-most items from being visible.
- Added a fix so newly created Objectives now appear immediately.

We've upgraded our emoji support in Shortcut, so you can now access tons of new emojis to add your favorite flair and reactions to your Stories and comments! Some of the new emojis include: 🧋🦖🤝
Improvements and Fixes
- Corrected the placeholder text in filter dropdown search bars
- Fixed a bug with filtering on Roadmap table view
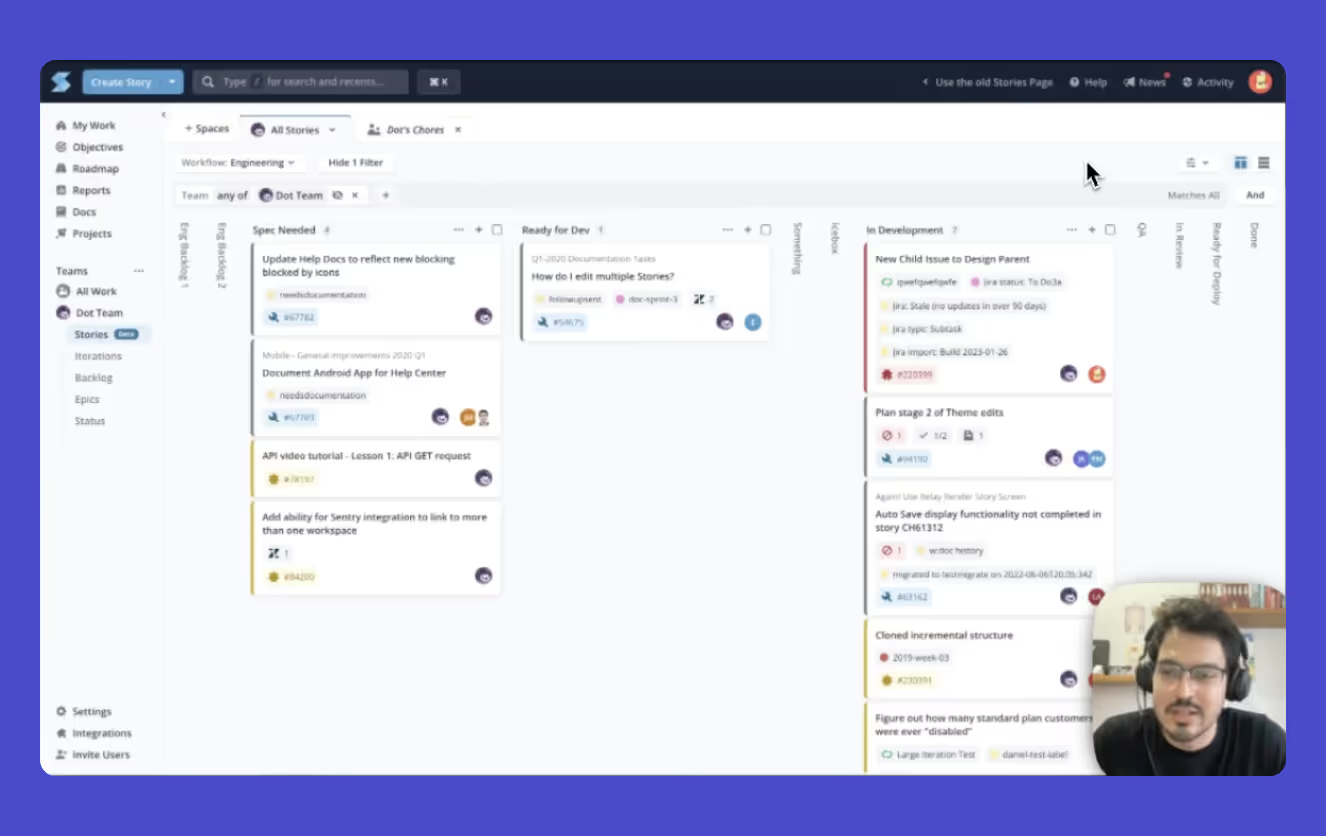
Get more done with the new Stories page! Watch the video to see how managing your Spaces on the new page is simpler, and built for your workflows.
Read more about it in our Help Center article →
Improvements and Fixes
- To keep week-of-year calculations consistent, we've updated our iteration automation to use the ISO-8601 definition
- If a Story is marked as done, the due date shown on Table View is no longer red
- Corrected an issue with sub-header backgrounds on Dark Mode
- Fixed a UI issue with gray background showing in red WIP limit columns
More space to plan and share your product strategy: Teams can now add up to 100 Epics for each Roadmap 🗺️
Improvements and Fixes
- Corrected a bug on the new Stories page with week headers
- When a user changes the filters on the Stories page, 'group by' is no longer reset
- We corrected an issue on the Reports page where nested dropdowns would close too quickly
Filter to Stories that were completed in the last day, week, month, 6 months on the new Stories page to quickly see what your team accomplished.

New Ways to Share and Reference Your Work
- Quickly Copy Branch Names: You can now easily copy branch names directly from the Pull/Merge Request dropdown in the Story Dialog.
- Epic Permalinks: Epics now have permalinks! Quickly copy a permalink for any Epic with a single click.
Improvements and Fixes
- Added team's colors to the WIP Limits Team Select component
- Corrected a WIP Limits UX bug
- Improved the loading pattern when you open a Story Dialog
- Kanban View now matches Table View by showing Story Count, Story Points, and Completed Points in grouped headers for a clearer overview.
- You can now access the "Move to Top" option in Story Actions when opening a Story via URL.
- Changes on the Roadmap page now reflect faster without needing a page refresh.

Pinned items are now located in your main navigation, making them easier to find and faster to access.
Improvements and Fixes
- The "Beta" badge is gone from the new Stories page, and we've added a "Legacy" badge to the old one as we prepare to transition everyone to the new experience soon.
- Fixed an issue where an Epic toast message showed up twice when converting a Story to an Epic.
- Hitting
enterin a WIP Limit field no longer clears all the values. - Fixed a bug causing workflow state columns to flash white in dark mode.
- Resolved an issue affecting Roadmap exports.
- Addressed a UI regression in table view on the Stories page.
- Fixed CMD+Click in Table view to open Stories in new tab as expected.
- Stories accessed through URL links (like in Slack or email) can now be moved to the top of their Workflow State column using Story Actions.

The faster Stories Page experience just got faster
We’ve upgraded the scrolling and pagination experience on the Stories Page, making it smoother, faster, and ready for more action. Now, you can load up to 12x more items on the first load while maintaining lightning-fast load speeds and seamlessly scroll through 5,000 stories per column.

Also new on the Stories Page - you can now right-click on a Story on the Kanban view and select "Move to Top" or "Move to Bottom" of a column, making it easier than ever to organize your work.
Improvements and Fixes
- Easily see when work was completed - the Completed column on the Stories Page now includes week groupings.
- Fixed an error affecting Epic creation.
- Updated the story type and iteration dropdowns to ensure icon colors display correctly in create and view story modes.

New: Work in Progress (WIP) Limits
Keep your team on track and spot bottlenecks early with suggested limits for Stories in development. Set up your WIP Limits via your Settings in Shortcut. Read the Help Center article for more details or watch our walkthrough.
Improvements and Fixes
- Resolved an issue in the Markdown editor where the Copy and Wrap buttons could be cut off at the bottom when a code block has no line after it
- Doc Relationships no longer flicker when opening a Story Dialog
- Fixed caching issues on the legacy Stories page that caused some users' views to become outdated. 🚀 Check out the new Stories page for even faster load times!
- Corrected a bug that prevented Iteration deletion
- Copying text into Story descriptions in Safari now works correctly
- Titles now wrap properly on Story cards

Keep your Stories aligned with Pull Requests! Using our VCS integration, you can now create a Story directly from a pull request by adding the comment [sc-new-story] on the PR.
Improvements and Fixes
- Observers can now view Shared Spaces on the Stories page by adding them to their tab list or accessing them through a shared link.
- Fixed a bug in the Integration modal where the Delete button was pushed off-screen.

Detail pages for Iterations, Epics and Teams now have collapsible sidebars, giving you more space to focus on your work, while keeping key information at your fingertips. Use the keyboard shortcut m for quick access.
Improvements and Fixes
- We've updated the 404 page for workspaces where the Docs feature is turned off.
- The error message for reaching the Key Result limit per Objective now explains why we cap Key Results and recommends keeping 2-5 KRs per Objective for better focus and impact.
- Google Drive files now display upon attachment without the need for a browser refresh.
- Improved performance in filter drop downs on the new Stories Page.

See only what you need: Visit the Features page in your Settings to toggle on/off Docs, Objectives and Iterations. If you do product documentation or track Objectives outside of Shortcut, simply toggle those features off and keep your source of truth where it belongs.
Work-in-Progress Limits Early Access Program
Work in Progress Limits is now available to Orgs with Early Access. Enable WIP Limits for any Team-Scoped Space on the new Stories Page for your team to help reduce context switching, identify bottlenecks, and improve focus by setting a suggested limit on Stories in progress. Learn more about the feature here. Want Early Access to WIP Limits? Fill out this form.
Improvements and Fixes
- Updated the confirmation modal UI when closing an unsaved Space on the new Stories Page
- Column title on the Status page no longer goes into neighboring columns
- Copy/pasting text followed by a URL now works correctly
- Corrected bug that popped up when tab switching with
Ctrl+Tab

- The UX copy in the New Stories Page tabbed menu for Spaces now says "Save" instead of "Publish," aligning with the save option used elsewhere.
- Teams can now add up to 20 Key Results to each Strategic Objective—more room to measure and celebrate all your wins!
- Shared Space URLs for a Space on the old Stories page now redirect to the same Space on the new Stories page.

Clearly see your project’s progress with our new Roadmap enhancement! Instead of hovering over each epic, you can now see more of the contextual health status updates at a glance, making it easier to stay on top of things and keep everyone in the loop.
If you don’t see this column in your Roadmap, you can easily add it via the Display toggle. It’s a simple way to give anyone looking at the Roadmap a quick update on where things stand and if anything needs attention!
Improvements and Bug Fixes

- Improved UI for workflow state name and metrics visibility in Kanban column headers on the New Stories page.
- For easier Epic creation, the 'Create' button on the Roadmap page navigation now creates a new Epic.
- Fixed a UI bug on the Objective page where the search box retained text from the previous Epic search.
- Resolved an issue with the print layout for Docs to ensure proper formatting.
- Fixed the image navigation within a story so it now correctly navigates between images.
- If a request to create a new iteration fails, the 'Create Iteration' button now correctly resets to its original state.
- Using our CSV Importer, you can now import an external link that's associated with a Story, such as a Helpdesk ticket URL, Slack thread URL or any other external link.
- Stories imported with a
completed_atdate will now retain their original completion dates when imported using the CSV importer.

Improvements and Fixes
- Updated pagination on Objective Detail Pages so you can now scroll seamlessly without having to click "Load More"
- Fixed a bug where columns were not hidden when applying workflow state filters
✨ You can now save changes to your Space using shift + s
Improvements and Fixes
- Corrected a bug with the sort comments button in the Story Dialogue
- Added a tooltip to explain when your team's roadmap has reached the maximum number of epics
- Fixed an alignment issue with the date marker on the Roadmap Timeline
- Added Move to Next Iteration in the context menu on the new Stories page for quick access
- Fixed a Story Dialogue comment button bug
- Corrected an issue with the Spaces tooltip
The latest changes to the new Stories page help you better manage Spaces. Your new Space menu drop-down is now in tabs where you'll see familiar options, like edit to change Spaces names. Publish unsaved changes so your team can see the same view and quickly see who owns each Shared Space in your tab list!
We've improved search with a new is:backlog operator, making it easier to find Stories in your backlog instantly.
Improvements and Fixes

- On the new Stories page, see the
and, orto help distinguish between the two filter groups available. - Copy code blocks with a single click! Simply hover over a code block and click the Copy button.
- Cleaned up the UI for the Space Tab Menu
- Added a fix to iteration automation behavior for UTC
The latest changes to the new Stories page help you better manage Spaces. Your new Space menu drop-down is now in tabs where you'll see familiar options, like edit to change Spaces names. Publish unsaved changes so your team can see the same view and quickly see who owns each Shared Space in your tab list!
We've improved search with a new is:backlog operator, making it easier to find Stories in your backlog instantly.
Improvements and Bug Fixes
⭐ ️On the new Stories page, see the and, or to help distinguish between the two filter groups available.
⭐️ Copy code blocks with a single click! Simply hover over a code block and click the Copy button.
⭐️ Cleaned up the UI for the Space Tab Menu
🐞 Added a fix to iteration automation behavior for UTC
- Fixed a bug affecting creating a new Epic from the Story Dialogue Epic
- Corrected the Roadmap Export PNG Image to properly capture the entire Roadmap
- Corrected a UI issue with Epic input fields
- Addressed an error that popped up when a new Workflow was created
- Docs section now expands after adding a Doc
- Fixed a bug with bulk select to remove Stories that have been filtered out
You can now quickly show/hide filters on the new Stories Page without removing them from your filter list. Easily run your team stand-ups by selecting/de-selecting owner filters and if you want your teammates to see the same view, save the filter state to your Space.

Community Slack Channel
- The Shortcut Community is now on Slack! Connect with other Shortcut users, the Shortcut team, and share what your team is working on.
Improvements and Fixes
- Fixed a bug with URLs containing Shortcut usernames
To help you work faster, we added more keyboard shortcuts for the Story Dialogue:
shift+Ito set the iterationshift+sto set stateshift+eto set estimatecmd+shift+,to copy branch namecmd+shift+.to copy branch name and move into development
Improvements and Bug Fixes
- Fixed a UI issue with the Jira Importer
- Corrected a UI issue with the Swimlanes view on the Status Page and the iteration filter now also works correctly
- Story states are no longer updated based on PR label activity after completed/deployed
- Updated a broken link in the CSV Export email
⭐ ️On the new Stories page, see the and, or to help distinguish between the two filter groups available.
⭐️ Copy code blocks with a single click! Simply hover over a code block and click the Copy button.
⭐️ Cleaned up the UI for the Space Tab Menu
🐞 Added a fix to iteration automation behavior for UTC
Introducing a NEW Stories Page, now available for new Shortcut workspaces

Built to make your daily tasks, iterations and work triaging simpler:
- Speeds up to 10X faster
- Instant interaction with story modals that render over the Stories page
- Manage your list of Spaces using tabs at the top of your Stories page
- A drastically improved filter experience
- Edit all of your personal spaces, even "pre-made" spaces from Shortcut
The new Stories Page is now available for new Shortcut workspaces. Existing teams can still use the beta toggle to opt in to the new Stories page. We'll provide a timeline soon for when everyone will transition to the new Stories Page.
Improvements and Fixes
- The new Swimlanes view on the Status Page now properly filters out other team's Stories, so you can effectively run your standups using only team-owned Stories!
- Added a No Iteration option in the Status Page Iteration Filter
- Fixed a UI bug for color picker select options on the label page
- Fixed an issue to now properly store feedback form drafts when you give us feedback via the in-app form!

The Status Page just got an upgrade! You can now check up on work-in-progress by each teammate with Story Owner Swimlanes and run team stand-ups within the Status Page. Soon, you'll also find Swimlanes on the new Stories Page.
Other improvements and bug fixed from this week include...
🐞 Backlog workflow states now correctly show on the Status
Page
What's New on the New Stories Page Beta
- You can now click and drag to horizontal scroll on the new Stories Page so it’s easier to navigate
- The filter type drop-down length has been extended to make it easier to see more options and search within it for added ease
- We’ve brought all our keyboard shortcuts to the new Stories Page to help you work faster
- Improved UI for accessing links to personal Spaces that aren’t shared
- The filtering experience on the new Stories Page has been updated for mobile users
- The Demo Workspace now uses the new Stories Page
We'll provide a timeline soon for when we plan to complete the Beta and fully migrate to the new Stories Page.
Improvements and Fixes
- Fixed a UI issue with workflow states from different workflows and groupings within tableview
- Corrected an issue with the Google Sheets integration so it no longer becomes disabled when encountering an error
- When creating a Story in-line on the new Stories Page, that team’s iteration is now selected for that Story
Spaces are now more discoverable on the new Stories page with an updated Space Menu UI.
Improvements and Fixes
- Fixed a Google Sheet integration error
- Fixed a UI bug for adding a story in-line within Kanban columns
- Requestor is now available as a column that you can enable on the Stories page and backlog table!
- When you convert a task into a Story, the task details are automatically added into the new Story's description, it's marked as complete, and the new Story is linked to that task
- More color options are now available for labels
- Expand and collapse Story comment threads in the story dialogue

Improvements and Fixes
- The search relevancy when you mention a teammate in Shortcut has been improved! Now, when you start typing a teammate's name, the most relevant names surface to the top of the list
- Fixed the padding for story comments and comment threads
- Eliminated a bug on the new Stories Page that popped up when loading more in table view
- Corrected a UI issue seen when dragging Stories into an empty column
- Corrected an error with cycle time reports
Moving data into Shortcut via CSV Import just got easier! Now, story types (string values feature, bug, and chore) are imported via CSV Import, and id is no longer a required field.
Improvements and Fixes
- Team icons now display correctly in dark mode on the new Stories page.

Estimate delivery accurately with Cycle Time
The Iteration Cycle Time Chart has been rebuilt for improved data accuracy and UX. Track the time it takes to complete stories and use data-driven insights to get a solid grasp of your team's processes.
Bulk-edit Stories on the New Stories Page
We've brought back the ☑️ at the top of each workflow state column to enable bulk-edit. Managing your Stories just got snappier on the New Stories Page!
Improvements and Fixes
- Enhanced our Github integration to show PR build status for GitHub Actions on the Story pane
- Fixed a bug that popped up in comment states when navigating between stories
- Team names on the Epic dialogue are now ordered alphabetically
- Corrected a tooltip bug on the New Stories Page
- Fixed login behavior to direct users to the workspace dashboard if logging in with no active Workspace association
Deleted user profiles can no longer be assigned as the owner of a Story via a GitHub integration action.

✨ Sync Slack threads to Story comments (and vice versa!) so teams don't lose important context or conversations. Check out the demo video.
👉 Contact your workspace admin to re-authorize your Slack integration to access this update.
View Epic Health on Epic Table View
Sort and organize Epics by health status or easily find Epics that don't have a health status.
Improvements and Fixes
- Fixed bug where reporting charts do not generate data with Advanced Custom Field filter when no value filter is selected
- Corrected an error that popped up when assigning an Epic to a Story with no Team assignment
Share your in progress and upcoming work! You can now export your Spaces with the most up-to-date filters as a CSV file by clicking "Export" in the drop-down menu.

✨ New Integrations: Embed Loom and YouTube videos in Stories and Comments
Explain complex ideas and provide feedback with pre-recorded videos. Paste any Loom or YouTube public link into Shortcut's Markdown editor and the link turns into an embedded video so you can automatically play it in the description field, comment or Docs.
Improvements and Fixes
- Fixed an issue where deleted comments were impacting the comment order
- Added mobile UX improvements to the Text Editor
- GraphQL comments in Docs code blocks no longer remove formatting
- Tasks and Story Relationships now persist in Story drafts after a refresh
- Added a fix for a story dialogue bug to speed up loading updates
- In Table View on the new Stories page, when you group by Iteration, the order is now descending to help teams with their planning workflow
- On the new Stories page, Epic Filter is now scoped to Team on Team Scope Stories Pages
- Fixed a bug with Space Save As on the new Stories Page

We continue to improve the text editor experience to create a better way for you to collaborate with your team. Add tables, diagrams, and quickly format comments using keyboard shortcuts or the updated Editor toolbar with more one-click formatting options. Any pre-formatted text you paste will retain its formatting - even links! - to ensure consistency and let you move faster.
✨ When you group by in tables, none is now at the bottom of the list of groups so you can view your highest priorities first.
Improvements and Fixes
- Automations are now attributed in Shortcut history!
- On the new Stories page, filtering on
not any ofworkflow states completely hides columns that are filtered out - Addressed drag and drop bug on the new Stories Page
.gif)
Table View on the New Stories Page Beta
View your Spaces in Table View and save that view setting to your Space! Also, save your Group By setting, as well as sort by and show/hide values.
Quickly Add a Story in Kanban Columns
Create a story in context of any workflow state column via the "+" or "Add a Story" in empty columns.
Create a new Story with Shortcut.new
You can now type shortcut.new into any browser and we'll send you right to the Create a Story dialog, as long as you're logged into your Shortcut account.
Improvements and Fixes
- Ordering of Workflows in CFD Report tooltip now matches the order of the chart (Unstarted > Done)
- Added a fix to the Velocity Chart so it now correctly matches the data in the Completed Stories table

We've added support for Mermaid in Markdown in Shortcut! Mermaid makes it easy to create and render detailed diagrams and charts, like flow charts, Gantt timelines, architectural mapping and more.
Get started by adding ```mermaid on the opening line of a code block directly inside description areas in Shortcut.
🆕 Epic health now displays on the Epic tooltip for easy readability of important details on hover.
Improvements and Bug Fixes
- Archived Objectives are no longer displayed in the dropdown when assigning an Objective to an Epic
- Emojis will now properly render in Titles in the Markdown editor
- Hitting the
esckey will no longer close the Story modal when viewing an image attached to the Story - The Story name will properly wrap on the warning modal when deleting/archiving

Easily share your team's Curated Roadmap using the new Export to PNG option
- Share a view of what's on the horizon and in progress for each team's Curated Roadmap with a click of a button
- Preview the export and download or copy to your clipboard to easily paste into other products such as Slack or a presentation
- What's on the page will be exported based on filters applied to make the view even further personalized prior to export
🆕 Markdown Experience
We continue to improve the markdown experience for everyone. We've added some options for link handling so when you're pasting links, you now get the choice to leave it as-is, or apply the Markdown using the Create Link option.

You can also now use the sum function in tables for columns and rows to help with basic math commands. The updated Markdown experience is now applied to Iteration and the Epic detail page description areas!
🌟 New Stories Page Beta
We're wrapping up our work on the new Stories page and shipping updates regularly. New this week: you can now Filter on Stories created and updated in the last 6 months, as well as Stories with Epic Labels. We also deployed a few fixes:
- Load more stories in
doneworkflow states that are >30 days since updated - If you move a story into
startedworkflow states, the story updates with you as the owner - Fixed a bug where a space was incorrectly showing no results
Also new this week:
- Backlog enhancement: Filter for
Requestersso you can filter the Backlog by who requested each story ✨ - Roadmap update: More actions have been added to the right-click context menu for easy Roadmap management, including: Move to top, Move to Bottom, Archive Epic, Delete Epic, and Copy the Epic link.
Improvements and Bug Fixes
- Use
ShiftorCMD/CTRL+ Right-click on a pinned Doc now works as expected - Objective Key Results no longer require a double-click to collapse upon first page load
- Emojis now properly render in Epic Titles/Descriptions consistently across Shortcut
Load Moreon the Backlog will no longer fail to load stories and cause blank Story rows to appear- Editing the description of one Story will no longer cause the description of another Story to stay in edit mode when navigating between Stories
xcan now be used within Markdown checkdown brackets to mark as done

Get context on planning progress with Objective health updates
Numbers only tell part of the story around whether work and goals are on track, at risk, or off track. Now teams can streamline tracking and add a health status and comment alongside Key Result updates. Let stakeholders and teams know exactly what's happening on Objectives in Shortcut in detail.
- Health status and comments can be added directly on the detail page or from the Objective tableview to keep track of changes over time to how your goals are going.
- The latest Health status and comments are displayed on the tableview and the health status on the column view to easily identify the state of an Objective.
- Filter and group by Health to easily identify blockers, discuss what's at-risk and make plans to move work forward.

Easily link and review planning documents from your Objective's sidebar
- Easily find and review important planning docs by adding them using the View Doc or Copy to keep important docs readily available for deep dives.
- Quick and easy Doc management with options to Archive and Delete Docs no longer needed quickly using the context menu
- Save important docs for later using the Pin option from the context menu to keep the most important planning and goal docs available in your pinned menu.
Improvements and Bug Fixes
- 📧 Get notified by email if your workspaces' GitLab integration is misconfigured/in an invalid state
- Roadmap progress bars in the table view no longer get cut off by the drag-and-drop handle on side-scroll
- Epics on the Objective Detail page will now show all assigned teams if the Epic is assigned to multiple teams, not just the first
- Selecting a new workflow from the workflow dropdown for stories in the Backlog will now properly update the workflow if changed
- Quick follow improvements for text editor on the Stories Dialog:
- Line breaks are properly handled and respect Markdown formatting around them
- Unfurls for Figma/Embeds properly show instead of turning into a Markdown "Link"
- The description area is now expanded after saving
- Markdown Tips now appear alongside the Story Dialog instead of behind it
- New Stories Page Beta:
- Resolved an error when clicking the back button
- Cleaned-up Story behavior when the workflow state filter changes on a Space

It's now more efficient to collaborate on content directly in Stories with improved formatting options. Highlights include:
- New Keyboard shortcuts for popular markdown actions to quickly add formatting, such as cmd+b / ctrl+b to bold
- Already formatted content can be pasted in and all formatting will be maintained. For example, if content is already bolded, we will auto-apply the markdown to keep the bold format!
- A new look and feel for the Editor toolbar with more one-click options to add desired formatting. You can also continue to manually type in markdown formatting if you prefer!
- Many UX improvements such as auto-applied placeholder text when pasting in links to make links cleaner, and 1-click table formatting for easy table building
🆕 Epics: You can now duplicate Epics via the Epics tableview and Epic Detail Page actions menu.
Backlog: Filter by Requester has been added to filter by all stories specific people have created.
Improvements and Bug Fixes
New Stories Page Beta
- Navigating within the Stories page workflow state columns no longer causes Stories to shift across columns
- Navigation "back" no longer causes a bug rendering the stories page
- Previously rendered stories no longer show up on a Space when switching between workflows
It's now easier for teams to move from Pivotal Tracker to Shortcut! Our new MIT-licensed open source import tool leverages our API to streamline the process of getting your data into Shortcut. Learn more in our Help Center article.
Load More on the Backlog page: Prioritize and manage Stories without the limitation of pagination 🙌
Bug Fixes and Improvements
During our Bug Bash we deployed 176 improvements, fixing bug fixes, addressing UI inconsistencies and removing paper cuts.
- Search Operator suggestions now scroll once show more is clicked
- Linking to a Story in a workspace a user doesn't have access to will now show a 404
- Dragging a file onto the Story Dialog now works correctly
- UI improvement for
Add Epicto a roadmap - The
'epic:'search operator now shows suggestions - an alphabetical list of available teams and a "show more" button - Profile photos now upload correctly
- Added a link to Shortcut status page from the Profile menu
- UI improvements for Help in Shortcut
- When creating a new epic from an empty Objective, the Objective is no longer listed twice
- Fixed UI bug with Objectives badges
- Removed Observers from Owner dropdown on Reports page as they are not interactive members
- Deployed improvements for new text editor experience on the Story dialog
- Corrected a routing issue when navigating twice to create workflow as non-admin
- Filter dropdowns are no longer showing up on top of Quick Search
- The drag-to-resize-sidebar control for the Docs sidebar is no longer over the minimize button
- Keyboard navigation improvements for search operator results
- Implemented UI improvements for Search
- Fixed an issue with Notion link previews
New Stories Page Updates
- Fixed an issue that caused stories in workflow state columns to consistently shift
- Corrected an issue with Avatar colors mis-aligning with the Avatar colors on the original Stories page
- Addressed an error that occasionally popped up when closing/deleting a space in the tab list
- Filter UI improvements
Over the past two weeks we've been diving into quality improvements, like fixing bugs and removing paper cuts. With just a couple of days left in our bug bash, we've already made 138 improvements, including:
- UI fix for setting up custom fields on mobile and you can now access the settings menu
- Teams moving to Shortcut can now better import their data with Story type mapping
- Table headers are now sticky on Safari
- Expanding/collapsing the collections page no longer changes where you're scrolled to
- A quick fix to help teams move from JIRA! Increased the width of the input fields on our Jira importer so you can better see what you're typing
- Users can now use the prev/next buttons on the search page
- When creating a team, the name field now auto-populates the team Mention Name
- Health is no longer hidden behind the text area when you're adding a comment to your status update
- When a Story is converted to an Epic, it no longer loses its Team association
- On the Home page, the My Stories column now shows all Stories that a user owns
- On the Iteration detail page, the right next arrow now functions properly
- Removed "new" badge from Workspace Features > Automations
- Slack integration now properly formats markdown URL reference style links
- Added a fix on label chips, so g's are no longer being cut off
- When a column is collapsed the workflow states headings are now one line
- Clicking
EditonCustom Fieldswhile editing a Story Template now goes to the custom fields setting page - Keyboard shortcut for "n" now correctly opens a new story modal
- The
'team:'search operator now shows suggestions - an alphabetical list of available teams and a "show more" button - Dark mode enhancement for table headers in detail pages
- UX enhancement to clarify that when creating a team you have to select a workflow to continue
- Fixed an issue when updating to a team so the user is now prompted to select the workflow the story should go into and then the target workflow state
- The first item of a team's context (right-click) menu is now aligned correctly
- Added Space to the top of the calendar range picker so iterations no longer look like they're cut off
- Fixed a UX bug so the file attachment overlay is no longer truncated in some cases
- Improved the Create Story menu to add template headings in Create Story sub menu
- Advanced search UX improvements to reduce input size and make operators full-width
- Accessing
/settings/teamsdirectly without a workspace now redirects to the teams page of the default workspace - Menu options now filter accurately relative to the keywords entered
- When creating a team using a name that already exists an error now lets you know it's a duplicate name
- If a user turns a task into a Story, the Epic and the Iteration from the initial story are now carried-over
- When navigating to settings directly from the Reports page, the loading illustration now displays on top of settings page content
- External links are now updated correctly when using the Update Multiple Stories API Endpoint
- Slack Create a Story action: now allows you to search for Iterations and select one for the newly created story to be assigned to
- When converting a Story to an Epic, the originating Story Tasks now get the same team assignment that the original Story had
- You can now Create a Story from the Epic and Iteration detail page Stories section
- Print Dialog now includes all the information on the Epic detail page
- Mobile UX enhancement Update Automation sub-headings fit better on screen
- Corrected a mobile issue with our billing notification email template
- Mobile UX improvement for new user invites
- Mobile UX improvement: so custom fields with long names now correctly wrap
- Mobile UX improvements for Settings pages
- Mobile UX improvements for Story Dialogue footer
- Fixed an issue on the Dashboard so the My Stories column scroll does not reset to the top of the column when switching tabs
- Corrected a bug with infinite loading in the story dialog
- If “Create Another” is selected in the Story dialogue the focus returns to
Story Titleso that you can create another Story quickly
New Stories Page Improvements
- Backend speed improvement for Stories 2.0 page tab list and Spaces
- Several Stories were deployed as part of Table View development 🙌
- Add borders to inactive tabs
- Backend change for memory bandwidth improvements
- When more stories load in a kanban column, the stories that you see stay fixed instead of shifting upwards
- The actions at the right of column headers are now aligned with the Story Cards in the column
- Changed the keyword filter name to
searchto better describe what it does - Investigated and fixed a bug with odd shifting behavior when loading Kanban columns
- When an unsaved space is saved as a shared space, the space name and permission is now correctly updated
- The dropdown for filter selection is automatically opened when a user selects a filter type (pill) to speed up setting filters on a Space!
- Fixed an issue on Safari so you can now see the Story card as you're dragging between columns/positions
- Added a UX fix by increasing the max width of our drop-down selectors for filters to help make long titles more legible!
- Stories are no longer missing from a tab when scrolling horizontally and then switching to an uncached tab
- In Team Scope Stories pages, if a user clicks create space and then closes the space without changing it, the space is automatically removed from your Space tab list and menu
- Quickly resolved a reported UX bug so empty collapsed columns no longer have scrollbars on hover in kanban view
- Corrected capitalization of Story Type in Filter Selector
- Tooltip for "undo changes" no longer shows up behind the Save/Edit Space menu dropdown component
- Updated the tooltip for "Add a Story" feature that is coming soon to the new page!
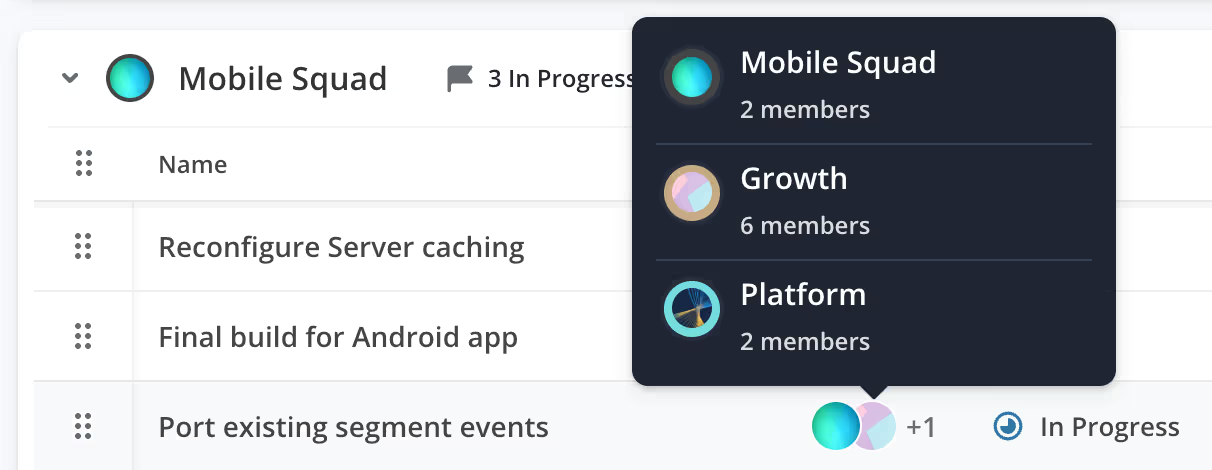
Add multiple teams directly to Epics to show multi-team ownership.
Improvements and Fixes
- New Stories Page Beta Quick Follows:
- Matches All/Matches Any filter groups enable an "or" conditional
- Removed an erroneous empty state error
- Added a fix to ensure backlog workflow states are in the right position in kanban view
- Clicking a link to a story comment reloads the Stories page in the background
- Coming Soon: "Add A Story" in Kanban columns!
- Today we're kicking off our Bug Bash, dedicating the next two weeks to fixing bugs and removing paper cuts.

Iteration Insights: Hit your Iteration goals with new at-a-glance versions of your Burndown and Cumulative Flow reports to quickly understand how work is progressing, identify bottlenecks in the process, and determine if you'll meet your commitments.
.avif)
Breadcrumbs show you which Objectives your Stories and Epics trace back to for easy discoverability, navigation and seeing how work connects to strategic outcomes.
Improvements and Fixes
- Search field for Objectives on the Report page now properly returns results
- Add Epics option under Key Results now only displays when there are Epics to add more
New Stories Page Beta Quick Follows:
- Added the ability to filter your Spaces by Project
- Fixed a caching bug related to drag and drop
- Solved an issue with 'Save As' in the Save drop-down menu
- Fixed a bug with drag and drop in Safari
- Visiting a Story comment link no longer causes an error

✨ Introducing the all-new Stories Page beta. It unlocks:
- Speeds that surge ahead by up to 10X
- Instant time to interact with story modals that render over the Stories page
- Manage your list of Spaces using tabs at the top of your Stories page
- A drastically improved filter experience
- Edit all of your personal spaces, even "pre-made" spaces from Shortcut
👉 Opt into the new Stories page beta via the switch at the top of your Stories page.
We are releasing more functionality and improvements on the new Stories Page regularly! Quick-follow improvements include:
- Search for custom field values
- Search for filter types
- Fixed a bug affecting paging between Stories
- Squashed a bug with enabling attachments to Stories
🗓️ Register now for our new Stories page webinar on March 26th. The team will cover what to expect from this fully redesigned page, what improvements come with it and what it means for the future of Shortcut.
Backlog
- Enable new columns on the Backlog Page, including: Labels, Created On, and Last Updated
- The "More Actions" dot menu is now available per story, allowing easy opening of the story, pinning, link copying and archiving
Improvements and Fixes
- Focus is returned to the story title dialogue after setting 'create another'
- Objectives: Key Results now expand by default to see the Epics assigned for easy discoverability
Update Objectives Key Results values through our 🔗API programmatically.
Pick up your next Story quicker - the Docs section on Epic and Iteration pages is now closed by default.
Improvements and Fixes
- Docs: Fixed a bug where comments where hidden if left near the bottom of a Doc. 🙌
- Reports: Clicking the legend of a Report now scrolls you back to the top of the page.
- Objectives: Objectives with start and end dates will now appear on the Roadmap even if the Epics within them don’t have dates.
- Epics: Epic Detail Pages no longer trigger dropdown edit, but properly trigger a new tab being opened when cmd+clicking on the View Objective Page option.
- Epic Health: When Epic health is updated, the email sent now clearly states that the email contains a new Health Update in the subject line.

Help, Now Powered by AI ✨ Goodbye to searching through long docs for answers, hello 👋 TL;DRs! Get quick, concise answers to your Shortcut questions with the power of AI.
Back by popular demand 👏 We've brought back the summarized tooltip on the new Iteration Cumulative Flow Diagram Report, so you can see the totals of all workflow states at once.
.gif)
- Navigate to Reports from an Objective Detail Page, auto-filtered to that Objective for easy reporting 📈
👉 Register for our Objectives Webinar on Tuesday, March 5th, 2pm ET/11am PT for a discussion all about Objectives, including best practices, tips for writing effective OKRs and how it's changed the way we work at Shortcut.
Improvements and Fixes
- Added a fix to the Light Mode Selector UI for Requestor Drop-Down in Story Modals
- Fixed the Upgrade flow from the Create Team modal by removing a blank toast modal
- Made Epics show their status and last updated on the Epic row in the Objective Detail Page
- Added a loading animation to the Roadmap to make it more clear that the page is loading

✅ Keep everyone informed on status by updating Epic Health directly from the Objective Detail Page
🙌 Key Result values can now be <0 and >100 to represent values of all kinds
🎯 Decimals are now supported in Key Result updates and you can edit the start value of a Key Result
Improvements and Fixes
- Fixed a bug so the Objectives filter on the Column View now appropriately filters the Epics related to the selected Objectives
- Corrected an issue so filtering by Objectives now correctly provides the right data back, showing all respective Objectives
- 🔗 Links in Objective descriptions now work properly and link you out to the URL when added via Markdown
- Don’t worry about story templates created/owned by teammates who left your workspace - they’ll work as expected without any error messages!
🎯 Connect Work <> Company Goals with Objectives
Create goals, align teams, and connect individual projects to company objectives. Now, not only can you roll up work across multiple teams in a tactical way using Objectives, but you can begin to track outcomes and impact using key results.

Get more information about Objectives with these resources:
- Check out our help documentation
- Visit our blog post
✨ Jumping from your activity feed to comments just got easier!
Clicking on comment notifications in your activity feed will now link you directly to the comment in the story dialogue.
Improvements and Fixes
- Shipped a fix for the Roadmap Timeline, so it no longer erroneously filters out Epics belonging to multiple Objectives.
- Fixed a bug that caused the detail page to error when an Epic was pulled into a Key Result.

🎯 Introducing Shortcut Objectives, a new way to organize product development work around company goals.
To help you reach your most important goals, we're introducing a seamless way for all teams using Shortcut to be more objectives-focused.
✅ Connect Planning with Execution
Ensure everyone in your organization is aligned with your company goals. Objectives let you define goals, connect them to Epics, and track ongoing progress. They help keep everyone focused and driving towards the right outcomes.
🚀 Drive Results by Keeping Objectives Top of Mind
Managing your goals in the same tool you use to manage your work prevents teams from forgetting the goals you initially set out for them, and ensures they're constantly aware of how their work ties back to each Objective.
🧠 Work Smarter with Real-time Visibility
Get a clear picture of all the Epics that are being worked on for each Objective and how much progress has been made towards each.

💡Two Types of Objectives: Tactical & Strategic
- Tactical Objectives allow you to group and track Epics only. (Use these for day-to-day execution)
- Strategic Objectives allow you to group both Key Results and Epics related to those Key Results. Use these for higher-level planning and OKRs. (Available only on Business & Enterprise plans)
- Note: Milestones are now called Tactical Objectives and can be found on the new Objectives page.
👉 Learn about what's changed
Improvements and Fixes
- Teams on the Teams Page are now sorted in alphabetical order -- now aligned with the same pattern as our dropdown and team navigation. 🙌
- Fixed issue where @ mentions in Docs comments didn't send a notification to the user.

It's even easier to see where your team's bottlenecks are with the new and improved CFD
The Cumulative Flow Diagram (CFD) helps you better understand your team's workflow, increases in scope, cycle time, and throughput! It now has color-coded states, an interactive legend and smart workflow defaults. It's the swiss army knife of charts!
Here's whats new:
- View progress by workflow state: Easily evaluate Unstarted, In Progress and Done work with the new color-coded bands.
- Hover for details: The tooltips for each band reveal their percent of the total and story/point count, as well as the total story/points on that day for all states.
- Choose your View: The workflow with the most stories in the iteration is now the default view or choose other workflows with stories in the iteration.
Learn more about the CFD here!
- Fixed a bug that blocked users from updating their automations
- Addressed an error when users attempt to create a team with the same name with an in app toast message
- Fixed an error that impacted the signup flow experience

✨Temporarily add Teams when opening shared links to Shortcut!
- Click a Shortcut link that's within the scope of a Team that is not in your navigation, the Team is temporarily added to your navigation!
- Add the "temporary" Team to your navigation using our context menu, or click to a different page and the team is removed

We’re redesigning Iteration reports to better convey progress and plan for upcoming work. Our first release is an all-new Burndown Chart!
Here's what's new:
- Track Ideal and Actual Remaining work on a daily basis, as well as stories/points that were Added, Removed or Completed each day via the tooltips
- Ideal Remaining forecasts how many stories/points should be remaining based on time left in the Iteration
- Toggle between Stories and Points with the chart default reflecting workspace setting
- Sync with Latest Data to make sure your chart shows any recent updates to the iteration
Get more information about the new Burndown chart with these resources:
- Check out our Help Documentation
- View our blog post about upcoming Reporting improvements
- Register for our Reporting Webinar on Thursday, January 11th, 2pm ET/11am PT for a look at how our own product and engineering teams use Shortcut to monitor progress and interpret insights!
Improvements and Bug Fixes
- Updated version of markdown in Shortcut to address in-app buggy behavior and cleanup our code under the hood 🙌

Align your teams' work with company objectives
Connect your company objectives with the work that supports them, so teams can prioritize what matters. 👉 Sign up for Early Access to Objectives!
Improvements and Fixes
- The comment icon on the Roadmap Health badge will now only appear if there are actual comments. The count will now properly show only comment counts, not total Health update counts.
- Addressed Custom Fields Setting Page regression

Your Stories page is about to get way faster
This new Stories Page is designed to zoom (it's as fast as a 🚀 rocket!), has a slick new filtering experience, and can be navigated with a keyboard alone if you prefer (yes, even drag and drop!). Sign up for Early Access!
Connect Work to Goals with Objectives
Define your company goals as Objectives to plan, drive data-driven decision-making, and ensure everyone's work contributes toward the company's goals. By connecting goals to everyday work, your team can focus on what matters to maximize outcomes. Sign up for Early Access to Objectives!
- Addressed critical bug impacting markdown and display in the activity feed
- Resolved an Epic view error
- Each report now has an info icon (i) that opens a modal detailing how to use the chart
- Addresses errors with some stories not syncing between Jira and Shortcut.
- The Roadmap dropdown for 'Add/Create Epics' is now wider for easier readability!
- You can now create multiple Stories in a row from the Backlog page with the "Create Another" option
Improvements and Fixes
- Align due date chip with due date color treatment across SC entities (missed from story card refresh)
✨ A dark mode enhancement: weekends on the Roadmap timeline now appear differently to better stand out.
Improvements and Fixes
- Restore Saving Drafts when the story modal is closed even when 'create another' is checked
- Accessing integrations and invite is even easier, with a link in the profile drop-down.
- Table dividers in dark mode are now visible once more
- The fixed left and right “handles” on tables now have a drop shadow so when scrolling it’s more visible there’s content either way
- Create/Add now prioritizes the teams’ Epics in the container with a header indicating such.
- Health badges have a new comment count and icon to help identify comments and updates for anyone viewing the roadmap.
- A 🆕 column has been added, Latest Health Comment, which shows a preview of the latest comment accompanying the health update. On hover the full latest comment will be displayed. This is on by default for everyone but can be turned off via the display options.
- Health updates now show the full author’s name for scalability/context (not just the avatar).
Improvements and Fixes
- When creating a Story via enter keypress (while focus is in the 'Story Title' input) the dialog remains open on successful Story creation if the 'Create Another' checkbox was checked
- Roadmap: When adding Epics to the Roadmap, Epics are now shown before you Search to make it easier to see by Epic status, which Epics aren't yet on the Roadmap to add.
- Epic Health is now displayed on the details page for each Epic! This can be set and updated now directly on the Roadmap or on a specific Epic page.
- Docs: Navigating to "Docs" in the left nav brings you right to your `Recent Docs`for quicker access to your most relevant documents
- Zendesk Integration: We've updated the login via Zendesk integration to resolve login issues based on the latest updates brought to Chrome.
- Roadmap: When adding Epics, the add/create dropdown will no longer close after adding a single Epic — It stays open so you can easily select multiple Epics at once.
You can now Group-by Iteration on Reports in Shortcut.
Improvements and Fixes
- When converting a Task to a Story, the original Task is deleted from the original Story
- When duplicating a Story, all details are now fully copied to the new Story draft
- Emoji reactions can now be added to any Health comments as a new way for stakeholders to engage with the Roadmap.
- Removed the count of updates from the 'Health' badge on the tableview of the Roadmap.
- On Business and Enterprise, the group-by Milestone on the tableview of the Roadmap is no longer available — this view can be replicated on the Epics page for teams, using the group-by Milestone functionality there.
Improvements and Fixes
- Fixed a bug causing the Story footer to be hidden on mobile.
- A new way to plan in Shortcut is available to all plans! Check out a revolutionary new way to build Roadmaps with our new Curated Roadmaps. Learn more here
- Updated Roadmap Health badge to include count of updates and an indicator it is interact-able
- Filters on the story page are responsive now on smaller screens and do not overflow
- Updating the the Health to "No Health" shows in the activity feed
- Clearing filters is now more clear with an x available to clear the filter, not remove all selected
- The Due Date column is now sortable on the Backlog page
- You can now move any Story to an iteration through the context menu options
- Import from JIRA Server using our CSV importer
- Shortcut got a new Logo! Learn more here
Improvements and Fixes
- Addressed JIRA Sync/Import json error when mapping issue + story type
- Backlog table is now sortable by Due Date
- Import from Jira Server using our CSV Import
- Adding the word "Updated" in front of the last updated date to make search results easier to scan and digest.
- We heard your feedback! Story ID is once again displayed in search results.
- Story totals on the Velocity chart are always whole numbers, so we've removed the decimal places on the tooltips of this chart.
Improvements and Fixes
- Backlog table now highlights rows when selected during bulk-editting
- Story filter row is now visually responsive on the Epic Detail page, no longer overflowing into the Sidebar UI
- Airfocus added to Integrations directory
- Allow older JIRA project domains to be excepted for direct import
- Link help documentation in context for Automations
- QuickSearch - New styling for QuickSearch results — scan more results and find what you need quickly
- QuickSearch - See Recents when you open QuickSearch for access to what you've recently viewed and created
- Keyboard Commands - Navigate search with just a keyboard — type / to start your search and arrow_down into results
- Search Results - Search results that prioritize title, content, and recency for more relevant search results
- Search Results - Cmd+K accesses the Keyboard Commands palette to quickly navigate and create in Shortcut
- Quickly create multiple Stories in a row with new "Create Another" Story option
- Improve chart headers/helper text for easier usage of Cumulative Flow Diagram report
Improvements and Bug Fixes
- Advanced Custom Fields with long names no longer break "Column Display" dropdown on tables
- Refine search results to prioritize strongly relevant results, yield fewer less relevant results
- Chart selections are saved when leaving and returning to the Reports page
- Only comment authors (creators) can `edit` their comments, admins can delete their teammate's comments
- Overlapping PR insights now supported for Gitlab!
Improvements and Bug Fixes
- Fixed bug related to the Lead/Cycle Time chart that was preventing the Reports page from loading
- Reports page persists your chart selections and filters when you leave and return to the page.
- Widths of Epics, State, and Milestone columns increased for easier readability.
- Action menus on tables now fixed, so you can perform a quick action without having to scroll all the way to the right
- Table alignments updated for consistency and readability
- Story due dates added to tables where stories are present. They can now be managed in-line without needing to open each individual story.
Improvements and Fixes
- Autofocus on Milestone search fixed
- Productboard integration no longer fails/blocks users if the token expires
- Search Bar for Team Selector in Settings reacts correctly to input values, enables selection of any team in the workspace
- Duplicate "pre-made" spaces from merged imported users (workspace "permission") removed from all active workspaces, and none should be generated in the future by this bug
- Resolved UI bug in Safari browser when epic moves to done state (on detail page), either manually or via automation
- Cycle Time report "Custom" chart type produces results when selecting a single workflow and custom start/end workflow states.
- Pull Request(s) related to a Story have an open/closed badge rendered based to the PRs status
.webp)
Our Automations help teams automate repetitive tasks when it comes to managing Iterations and Epics so you can spend more time on high-value work like strategy and creative thinking. Now you can:
- Auto-start and auto-complete an Epic
- Auto-create future Iterations
- Move unfinished Stories to the next Iteration
Improvements and Fixes
- Shipped a smoother, more responsive, and intuitive scrolling system on tables across Shortcut
- Updated table header column to End Date (from Due Date) to read more logically
- Configured headers for the Reports Filters and Reports view configuration to stick as users scroll for a better viewing experience
- Allowed users to set Report view configuration values on an Epic’s report page so settings carry over to the next Epic Report page that the user navigates to
- Enabled users to map their Stories to the Backlog Workflow State type when using any of our importers

Note: this feature is only available on the Business & Enterprise plans
🤝 Get visibility into blockers and work harmoniously as a team with Overlapping PRs
If you are working on a Story with a PR that overlaps with another PR, you'll be able to see it directly in a Story before you get to the merge stage so you can effectively collaborate with the right people to avoid frustrating merge conflicts.
Coming soon: Overlapping PRs with the GitLab Integration
Improvements and Fixes
- Updated the VCS custom branch format to allow including the Epic Name in the branch name
- Changed the main Workflow dropdown on the Stories Page for a more streamlined user experience
- Switched the endpoint for the GitLab Integration to support file capture for GitLab Merge requests

The latest in our series of table enhancements makes it possible re-order columns to prioritize the order you want to see information across your tables! Couple this with our last update that allows you to choose which columns to display in your tables for the ultimate in table customization.
By popular request - we also added another customizable item - the ID column is now toggle-able, so you can hide it if you prefer to work with names not numbers.
🤓 Introducing HelpHub: A smart and streamlined help experience

Our new, in-app help and learning center meets you where you are with relevant content. Open HelpHub on any page to find recommended resources. Have a question about a feature? Try HelpHub! Find and read help articles right in app. Learn more in this blog post
Improvements and Fixes
- Gave Milestones the KonMari™ treatment by adding the ability to archive them, because even Milestones need a break sometimes
- Made the Estimate column on the Backlog Table editable and sortable, because numbers need to be free to roam and find their place in the Backlog wilderness
- Refreshed the style of PRs, branches, and commits, bringing them in line with our snazzy new UI styles
- Spruced up the create experience for new users by making it possible to create new in-line on the Teams and Labels Pages
- Fixed the "Template Workflow discrepancy" that was blocking Workflow State deletion
- Squashed the "Invisible Backlog Stories" bug so you won't have to resort to magic to find your Stories
- Boosted the Stories Table rendering performance, to deliver the zippy performance you expect in Shortcut.
- Released an update that ensures default Spaces (Everything, Owned by me, Requested by me, Current Iteration, and Bugs and Fixes) display the Backlog States on the Stories Page. Now you can see them all in one place!
- Resolved the issue where Milestone headers would vanish when users viewed the page in certain resolutions. Magic tricks are best left to the professionals!
- Squashed a bug in CSV Import that caused trouble with blank Workflow State values. Now importing data is as smooth as silk! (See all the ways to import you work into Shortcut in the video above!)
- Updated the Rollbar logo in the in-app Integration page and on the site to match their updated branding. Looking sharp!
- Enhanced the user experience for targeted releases by making updates to feature flags. Now it's smoother than ever!

Released a new sticky Bulk Edit Stories button that stays in view when scrolling - just like an unstoppable superhero sidekick to help you move as fast as lightning.
Improvements and Fixes
- Revamped the Roadmap Timeline View experience for easier access to filters - almost as easy as picking ice cream flavors!
- Added start and end date selection to the create Milestone dialog—time-traveling DeLorean for project success!
- Gave all tables a little makeover, now the scrollbar plays hide-and-seek until you're ready to scroll to reduce visual overload.
- Conquered a pesky Epic comment deep linking bug so everything links properly, as it should!
- Fixed stubborn Epic Labels error in the Google Sheets Integration—now they embrace changes to Labels like chameleons.
- Summoned magical tooltip for Docs title in Docs sidebar—Abracadabra, productivity boost!
- Added an 'Estimate' column to the Backlog for better organization of work and planning.

Introduced a new and snazzy default Current Iteration Space! For organizations using Iterations the new Space is accessible with one-click and you're zooming in on the critical stuff!
Improvements and Fixes
- Abracadabra! We made legacy code disappear associated with Space. Goodbye to the pesky remnants of the past - eyes on future.
- Performed a little makeover on our Notion integration settings page - now it links with our Help Center documentation as it should. No more time wasted on detours.
- Squashed a mischievous bug that caused duplicate pre-populated spaces in the Team focus navigation menu. Seeing double? Not anymore. Problem solved!
- Granted users the power to filter the Time spent in Workflow State Chart to completed Stories. Better insights are now served up faster than ever.
- Merged grouping headers on sections of tables - much like adding a new accessory to a stylish ensemble - group headers are looking sharp!
- Gave our Cumulative Flow Diagram a reality check so there's no more projecting data into the future. These charts are staying grounded in the present.
- Updated the Cumulative Flow Diagram reveals all Stories in the specified entity. The Report Page CFD now includes all completed Stories.
- Fine-tuned the Cumulative Flow Diagram on the Reports Page to be a lean, mean, storytelling machine. It cuts out all those "out of scope" tales and focuses solely on the Completed Stories.
- Revamped the onboarding survey question for "Other Tool" to provide new users a better onboarding experience
- Meet our new friend, the Docs expand and collapse toggle! It's a handy buddy when viewing Docs in entity blocks the way you want to.

Get live previews of Shortcut Stories, Epics, Milestones, Iterations, and Docs directly in Notion. Just drop Shortcut links into Notion docs, allowing your team to access real-time updates and visual previews from Shortcut without missing a beat.
🎨 Customize your table columns
You are now able to customize which columns display on any Shortcut table so you can focus on the content that's important to you...without scrolling!
Coming soon: Column reordering!
Improvements and Fixes
- Bid goodbye to Archived Stories cluttering your Workflow Chart, thanks to our new filter that knows how to separate the forgotten tales from the present ones.
- Kicked Archived Stories out of Reports like uninvited guests crashing a party - now your Metrics Dashboard and Completed Stories table are more accurate than ever!
- Exterminated the pesky bug that caused Archived Spaces to re-appeared in the left-menu.
- Improved our toast notifications with a stylish makeover, complete with new colors and border styles, because even notifications deserve a little fashion upgrade.
- Caught the Miro integration bug mid-flicker and reminded it that disco moves belong on the dance floor, not in embeds.
.avif)
Spruced up the Team experience for existing users by presenting them with a Join Team screen when invited to a new Workspace.
Improvements and Fixes
- Empowered auto-joining users to handpick their desired Team so their experience is tailored and organized to fit the way their team works
- Squashed a pesky settings bug on the Workflow States Page to ensure the search results populate results
- Gave the Story Type and Status icons in the Backlog table a makeover, downsizing them to harmonize with their table companions and promote visual balance
- Fixed sign-up issues in the Firefox browser that were causing a few sparks, so you could surf our platform with peace of mind and browser harmony
- Put an end to the adventurous teleportations of the Docs cursor, ensuring it stays put and behaves itself instead of randomly teleporting to the bottom of the page like a mischievous traveler

Supercharge collaboration and alignment with real-time editing and previews of Miro in Shortcut
We've integrated the power of Miro, a visual whiteboard tool, into Shortcut to supercharge collaboration and alignment across teams. Together, the two platforms create a powerhouse for every initiative, providing a space for ideation, and bringing structure and organization so that teams can see the full picture of work.
A Miro board can now be embedded anywhere that you can leave a comment or description in Shortcut. When you paste a Miro link, others will be able to see previews and collaborate on boards directly from Shortcut. No configuration is needed to start using the integration!
Learn more in our blog announcement or read our help center for more guidance.
Improvements and Fixes
- We caught our Space filters toggle doing the limbo, trying to be both open and minimized at the same time. We explained that life isn't a magic show. So, we pulled off a fantastic bug trick and made sure it picks a side. No more toggle confusion!
- Our Docs cursor went on a wild escapade, getting stuck in a love triangle with other people's cursors. We played cupid and untangled the mess. Now, you can scroll through Docs without witnessing any cursor drama even when others are playing in the same Doc. Keep calm and cursor on!
A new Team-Focused Navigation for better focus, reduced noise, and more joy in Shortcut
The Team-Focused Navigation is here! Zoom into the work that is most relevant to you by adding Teams to your navigation, to access the Stories, Epics, and Iterations - filtered by team! Unlock the power of Shortcut using the new navigation and filters to optimize how your Team works in Shortcut.
The latest update
- Reduces clutter, so you can focus on just your Team's work
- Onboards your new teammates more quickly
- Makes it easy to get up and running with new Teams - not tied to historical configuration
- Quickly allows context switching between Teams
.gif)
Get more information about the new Team-Focused Navigation with these resources:
- Checkout our help documentation
- Visit our blog post
- Join us for our Webinar tomorrow (5/9), 1pm EST/10am PST for Team Navigation best practices and Q&A - RSVP here
Improvements and Fixes
- Expanded the Jira Sync to support bidirectional updates for Story Title and Description. Now you can bidirectionally update to your heart's content!
- Improved the new user experience so they have their navigation all set up with the Teams they are a part of, and only the first Team is expanded. Plus, new users will land on the Stories page for the expanded team. Smooth sailing from here on out!
- Corrected an error so that all Story cards in the app are now set to the standard Story card density by default. Only the Stories Page cards are minimal by default. We know how important it is for things to look just right.
- Updated empty screens to make it easy for users to learn and get demos about features like Milestones and Advanced Reports available to the Business and Enterprise Plan so you can try it before you buy it!
- Fixed a bug so that Team avatars render the Team's color consistently across all of Shortcut. We believe in being consistent in all things, especially team colors.
- Squashed a bug so that new users of new orgs are automatically taken to their Stories Team Page with the All Work page collapsed. Because, we all need a little breather now and then.
- Corrected an error that caused the Help drawer on the Organization page to blank out. We don't want you to feel alone in your time of need.

Unveiled the new Associated Filters on Epics and Iterations Pages, making it a breeze to explore other Teams' Epics and Iterations while browsing Stories owned by the filtered Team. Or, simply toggle the "Associated Teams" filter and enjoy the magic! (Don't forget to check out the gif to witness the awesomeness in action).
Improvements and Fixes
- Introduced a handy keyboard shortcut that whisks you away to the Backlog Page in a snap. Goodbye, unnecessary clicks!
- Resolved a bug that had the Team image on the Team Detail Page doing some strange acrobatics. It's back to looking normal and professional now.
- Kissed goodbye to a pesky Docs error that used to trap users in an endless game of closing the Shared button dropdown. You're now free to explore and collaborate without any unexpected surprises.
- Restyled the Quickstart Guide with fresh list items and icons, so new users won’t feel like they’re stuck in the early aughts anymore - AKA using Jira.
- Settled a fight between the Labels Page and Story Counts so that Story Bulk updates and Epic Deletions now act properly.
- Cured a Jira Import ailment that was plaguing some organizations.
- Counseled a feeling-left-out Docs bug that caused the toolbar to not show an active state when highlighted text was selected
- Put the Docs cursor in its place and told it to behave whenever entity badges wrapped lines
- Convinced Docs to stop rudely showing blank Untitled Docs in Recently Viewed items.
- Admonished the Quicksearch bug so it stops bothering everyone with its persistent popover misbehavior in Docs.

Improvements and Bug Fixes
- Added more in-app messaging to get you to move from Projects to Teams and Custom Fields … because we want you to move from Projects to Teams and Custom Fields, if you haven’t heard.
- Removed extra copy in the “More Spaces” menu, so now there’s even more-more space.
- Added a notification via Slack when someone @mentions you in a Doc comment - instantly feel like the most important person in the Doc.
- Updated Doc owners to be automatically made followers on their Docs - who says you can’t be both a leader and a follower?
- Added previous and next buttons on Docs with multiple Stories for quicker viewing of related Stories. Like turning a page in a story.
- Squashed a bug that caused the cursor to act like it's had too much coffee in a Doc.
- Fixed a bug that caused some Doc sub-pages to show “Create Story” instead of “Create Doc” on the button - the horror!
- Fixed a Doc cursor bug so tabbing within a table allows you to navigate through each cell as expected, as there’s enough uncertainty in this world.
- Restyled the Integrations dialog to include updated icons and include newly added integrations and it’s feeling much cooler.
- Updated the churn survey to randomize answer options and ensure we learn how we can better improve the experience for all users = less churn.
- Fixed text in Workspace Settings to be readable by screen readers. Being readable for readers is a good thing.
- Made Terms of Service and Privacy Policy links open in a new tab, because honestly, how long are you going to keep these open?
- Billing FAQ links will also open in a new tab, because billing is almost as boring as any terms of service page.
- Jira’s the worst, but Jira Sync is the best, and we made step 6 more clear: “As new Stories are created and move through Workflow states in Shortcut they will automatically be moved to the corresponding synced workflow state in JIRA.”
Improvements and Bug Fixes
- Added “Open in New Tab” to the Context Menu = the more tabs the merrier.
- Squashed a bug that caused unselected Spaces to invade the side navigation = we respect your personal space.
- Fixed a bug that caused the Story dialog to close when users hit ESC = not all escapes are created equal.
- Shipped the ability to use modifiers when clicking on a Story = a great many options: Cmd+click for new tab, Shift-click for new window, and middle-mouse-click for new tab too (for those without a trackpad).
- Squashed a bug that caused Workflow States to get cozy together when there were too many States on the Workflow Settings Page = again with the personal space.
- Added the ability to invite someone to a Team when inviting them into Shortcut = be congenial.
- Made it clear who has invited you when you have been added as a new user in Shortcut = keep your friends close.
- Updated Invite New User section to make it clear that Observers (view-only access) is available to Team, Business, and Enterprise Plans = everybody wins.
- Fixed a JIRA Sync bug so the Jira logo shows up on the Story modal when the user selects the right Workflow, and when the card is created and synced = even though the Jira logo does not bring us joy. (Jira = bad. Jira Sync = good.)

🌑 Join us on the dark side - Dark Mode 2.0 is here!
We’ve ramped up the contrast in Dark Mode to improve readability and reduce eye strain. Plus, it looks cooler. Experience what the dark side has to offer by selecting the Dark Theme in the Theme Selector in the Avatar menu.
📝 Code Block Improvements in Docs!
Now choose from 38 languages! You'll get syntax highlighting directly in your code block.

Improvements and Bug Fixes
- Projects are being phased out over time. We now explain this better in-app. (Also, check out our help documentation on how to transition from Projects to Teams, and Custom Fields. For questions about Projects, please reach out to our Support Team.)
- Fixed the Docs cursor problem when typing or deleting the "/" - no more slash and burn.

Suggestion Mode lets you suggest changes that can be reviewed and accepted by your team in Docs. Toggle your Docs between Editing and Suggesting Mode to make proposed changes and see others’ proposed changes.
This feature is available for trialing companies and orgs on Team, Business, and Enterprise Plans. Learn more about Docs here.
Improvements and Fixes
- Moved pop-overs to appear below the top level header, so you can still see the top level buttons and know where you are. Never get lost again.
- Fixed a bug so changing Workflows reveals all the Stories on the board, with or without Projects.
- Made a UX copy fix for the Spaces Menu tooltip, which incorrectly used Workspace instead of Workflow. Never to be confused again.
- Fixed a bug that caused a persistent red alert on the news icon in the top navigation. No need to feel like the world is ending anymore - at least in Shortcut.
- Consolidated Help and Learn content to open from Learn in top navigation, and Help in left navigation. Never feel confused - at least not in Shortcut!
- Updated Doc owner to not appear in the Doc Access dropdown if they are no longer part of a Shortcut Workspace. No need to keep exes around.
- Coming tomorrow: access to Public Docs will be available only to orgs on Team, Business, and Enterprise Plans.

Optimized the Recently Viewed section, so you can quickly find that Doc you closed this morning and see it.
Improvements and Fixes
- Improved our onboarding experience - we've assigned pre-populated entities to the pre-populated Team in Shortcut which you have to see to believe
- Fixed a bug that sometimes caused a Story on the Stories Page to be treated as if not viewable in the current space, but now we treat it right - it tells us it’s finally feeling seen
- We fixed a bug that caused user profile icons to break in our Demo workspace. No longer. Now your profile icon can finally shine - talk about feeling seen
- You can now report inappropriate content on a Public Doc - because some stuff nobody wants to see

We’ve updated the look and feel of the Roadmap including a wider view and refreshed styling.
- Wider Roadmap so you can plan easier and see more of your work
- Refreshed styling for the Milestone & Epic cards so you can see the work more easily
- New row hover styling to easily see where you're hovering and what Milestones and Epics are grouped together
- Accessibility improvements for the header columns and the month/day columns
Please note that these changes do not impact functionality. Enjoy!
Improvements and Fixes
- Fixed the Google Calendar integration bug so your due date events don't disappear (though you may wish they would)
- Saved Spaces no longer suffer from forgetfulness upon refresh
- The UX copy on our Workflow tooltip is now as clear as Hemingway would have wanted it
- Admins can once again work their magic in Shared Spaces
- Why would Spaces populate inconsistently? We fixed that.
- Optimized our demo org for all the new people out there
- Updated Docs notifications to honor global email notification settings, because we aren’t rule breakers, except when the rule is using Jira
- Fixed a Roadmap bug that prevented Epics from being able to be re-positioned vertically, so position away
- Avatars now render correctly, which is good news for avatars
- It’s no longer Groundhog Day for those Docs in a refresh loop

- Annnnd we’re in space: creating and updating Spaces just got easier with our new unsaved Spaces experience.
- Fixed a bug that was messing with time travel (date changes) when dragging and dropping Epics and Milestones in Safari and Firefox.
- Removed the “Show Archived” filter from the filter options which our filter experts have deemed irrelevant.
- Speaking of time travel, we made the Stories page faster when users change filters.
- Eliminated the occasional macabre appearance of empty or broken browser notifications.
- Added notifications for Jira Sync failures because we like to keep you in the loop… because we’re better than Jira.
- Fixed a Story Templates bug so that your field selections will be remembered now and forever.
- Speaking of time and space, we fixed an intermittent error that stopped Story Cards from appearing correctly when you access a Space.
What's New
❗Unlock better prioritization and planning in Shortcut with the Backlog
Our Backlog is here to help all software teams optimize their planning and prioritization in Shortcut! The Shortcut Backlog provides a view of work that can be prioritized for the development team based on their roadmap and goals.
The Backlog makes it possible for organizations to :
- See new/un-planned work separately from work that is ready to schedule to an Iteration
- Have confidence in which Stories are ready for developers to pick up
- Provide clarity to everyone in your organization where Backlog Stories live
Learn more about the Shortcut Backlog here!
🔄 The new Jira Sync makes it easy to try Shortcut risk-free!
Try Shortcut risk-free. The Jira sync allows you to pull in your data from Jira so you can give Shortcut a try by running a sprint or small project. It's easy to get started:
- Click Sync
- Authorize the connection
- Map your data and team
- Done!
Learn more about the Jira Sync here!
🛡️Scale your team and added security with SCIM
Now you can provision Shortcut users automatically from an enterprise’s ID provider. SCIM is currently available for those using SAML SSO & Okta today, other providers are coming later this year. Contact Shortcut Support to get set up.
🚀 Attend the Q1 Release Event!
Don’t forget to register to attend our release event on March 1st at 10 AM PT - we’ll do a deep dive into our newest features like the Backlog and share what we have planned for 2023!